
Does asset allocation work in the longrun?
Last week, Mist published yearly returns of various asset classes from 2013 till Dec 2022.
I take a deeper look at the numbers and what does it all mean for investors.
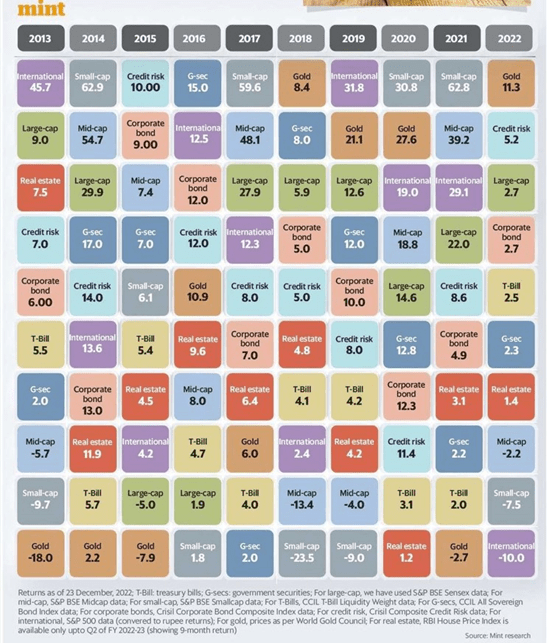
The image looks underwhelming and does not seem to lead to any conclusion.
Let me try to simplify the data.
Table below makes it easy for you to read the numbers
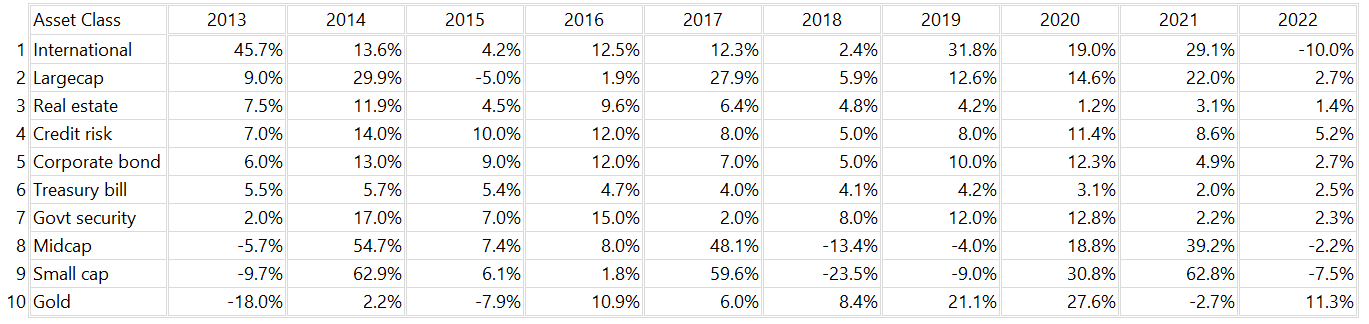
You can edit text on your website by double clicking on a text box on your website. Alternatively, when you select a text box a settings menu will appear. your website by double clicking on a text box on your website. Alternatively, when you select a text box
International fund leads the performance table with over 15% CAGR returns over 10 years. This was followed by Small, Mid & Large cap.
But that's not the total picture, and returns are not in a straight line.
Though we have only yearly number, we can still get a better picture of various asset class performance. Only focusing on end to end returns is not going to help an investor.
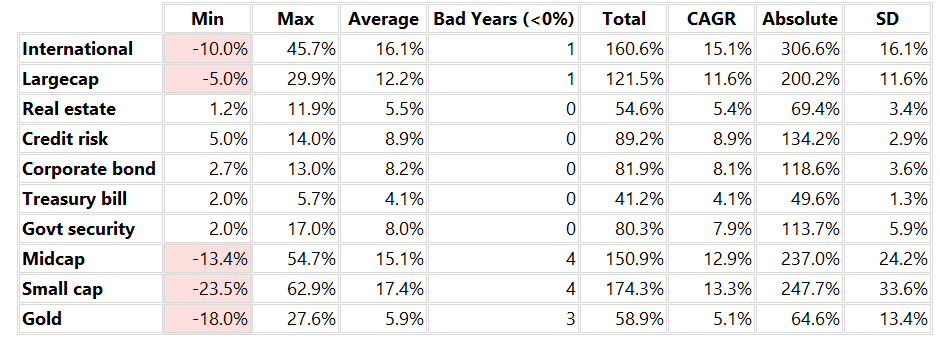
SD stands for yearly volatlity
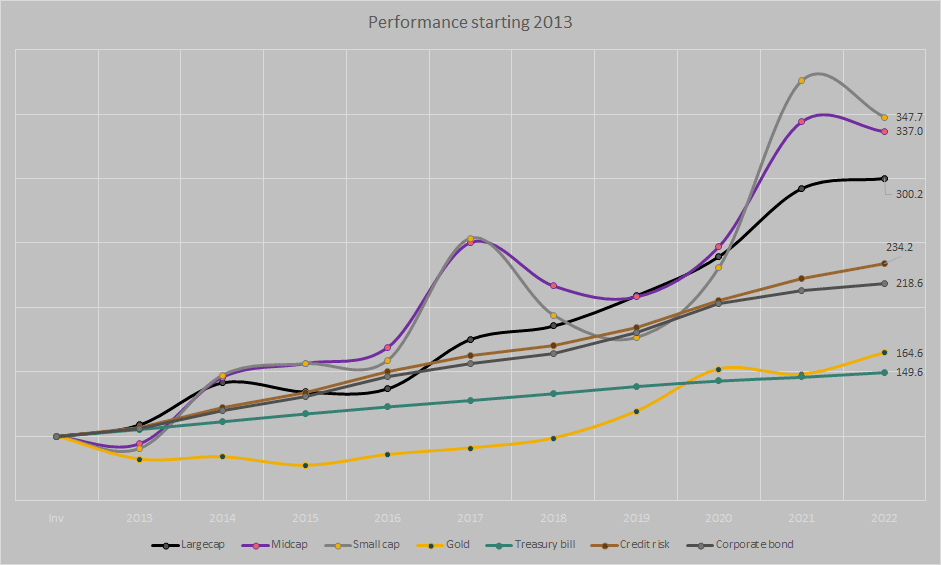
Performance of Asset Mix (ignore international)
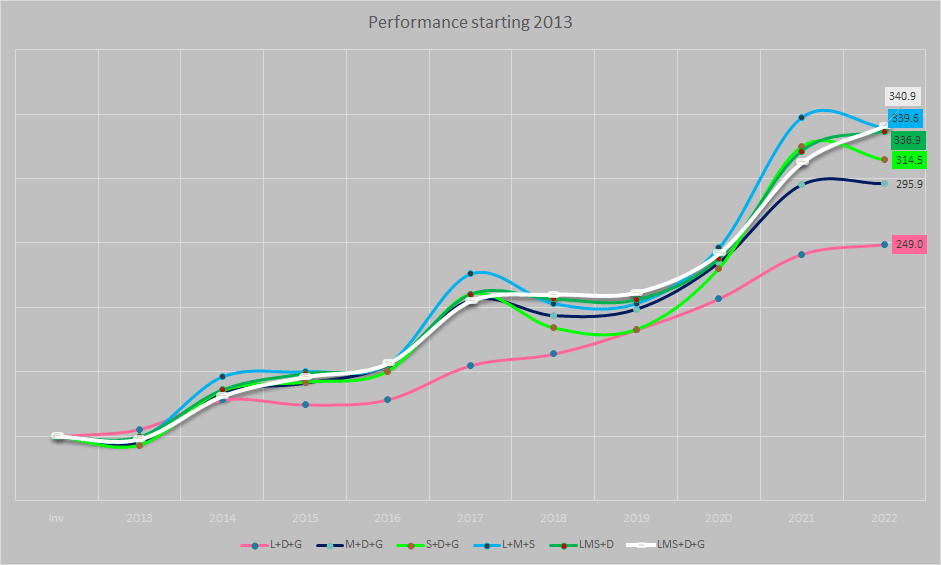
Assuming you had invested in a mix of asset classes, these are the numbers you would have got 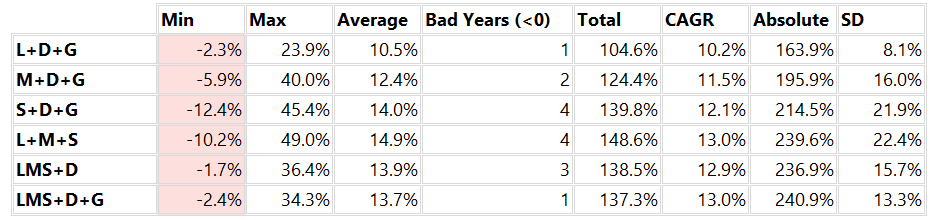
The best portfolio was a mix of large, mid, small cap along with gold and debt.
And if various experts views are taken seriously, the 2023 is likely to be a year of asset allocation.